3 Key Features of Denali Business Intelligence

A challenge for any business or nonprofit organization is the ability to analyze data from multiple sources and transform it into meaningful information. Business Intelligence (BI), analyzes the data for you and creates reports, graphs, charts, and other visual aids to give you further insight into your organization’s performance. A step up from simple dashboards of years past, BI software offers drill down options, forecasting, trends, and alerts that truly help you plan for the future.
Cougar Mountain Software is excited to offer this technology to our customers with our new product, Denali BI powered by Sisense. Below we will talk about three key features of Denali Business Intelligence.
DATA VISUALIZATION
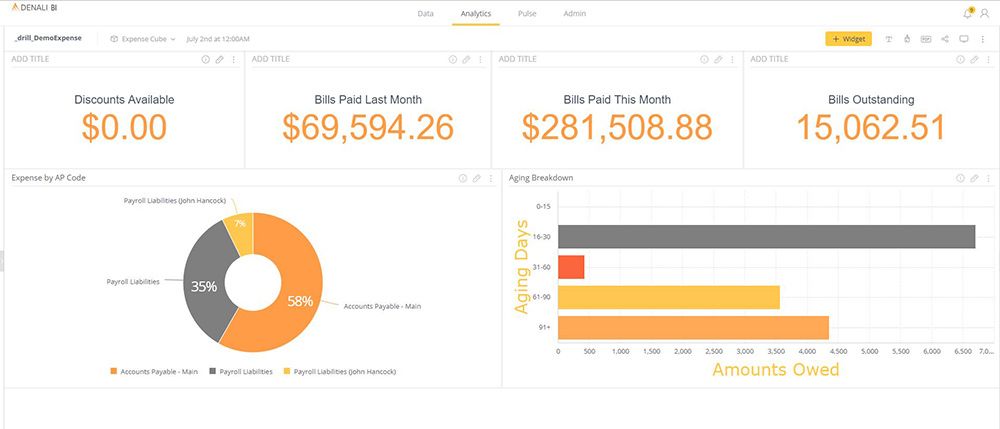
One of the biggest draws of any business intelligence software is the ability to see how your data looks in graphs, charts, and other easy-to-read visual aids. Denali BI gives you the ability to view multiple sources of data in one place making it easy to interpret and use for planning. Two dashboards are available to you immediately when you log in to Denali BI.

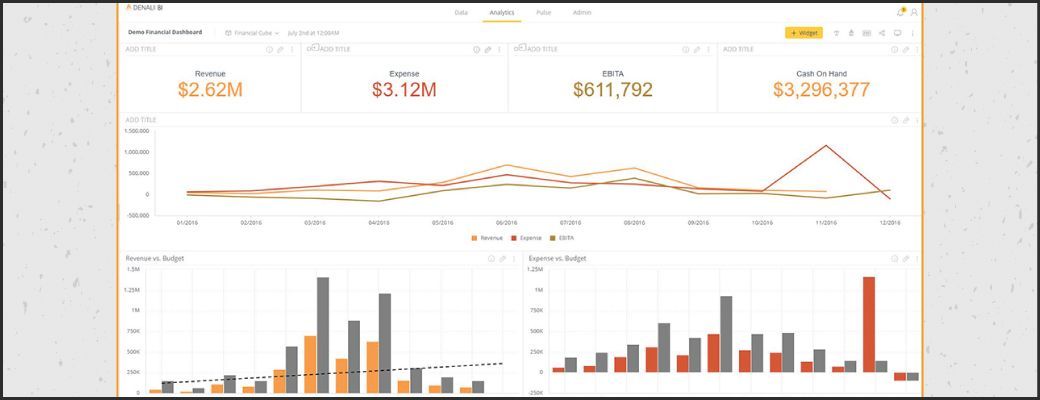
The Financial Dashboard gives you the ability to analyze your organization’s finances based on your revenue, expenses, and budgets, plus you can drill down into your data right to the posting number.

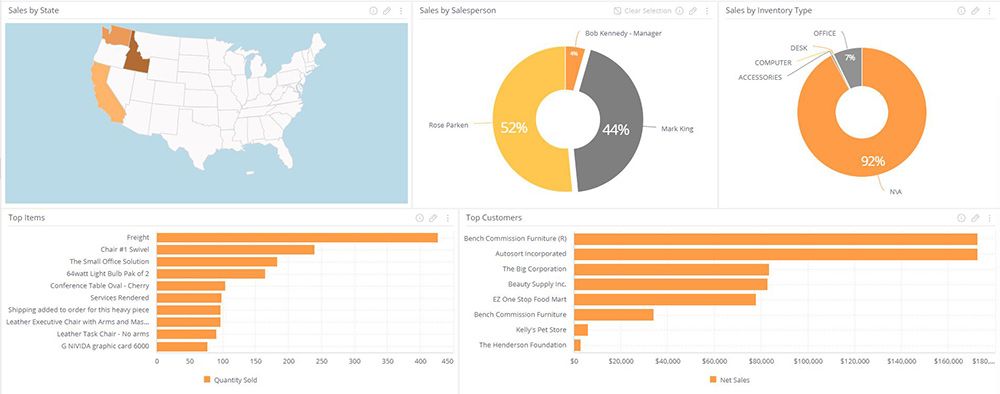
The Sales Dashboard is where you can view dollar amounts, top items, top customers, salesperson performance, and more.
The dashboards included with Denali BI are just examples of the many you can create with your data. You have full customization options, so from a general overview to specifics, the layout of each widget is based on what you want to see.
Denali BI shows you the big picture so you can see your progress, but also forecast and plan with confidence. Plus, you can share any of your dashboards with other users across your organization.
SECURITY
Just like Denali’s individual user rights, Denali BI also gives you the ability to set access rights based upon roles within your organization. Users can be assigned one of three roles in Denali BI.
Administrators have access to all the options within Denali BI. This includes creating any additional dashboards your organization needs, adding and managing other users, managing the data, and more. Plus, Denali BI allows you to have multiple administrators.
Designers have access to the data within Denali BI and can create new dashboards. They can also share the dashboards they created with other users. Designers can manage the data within Denali BI, but cannot manage other users.
Viewers can’t edit or create dashboards; they can only view dashboards that are shared with them. A viewer can drill down into the dashboard’s data, set filters, and create alerts. Viewer rights are especially useful for people who only need to see a good overview of the organization, such as board members.
Pulse Alerts
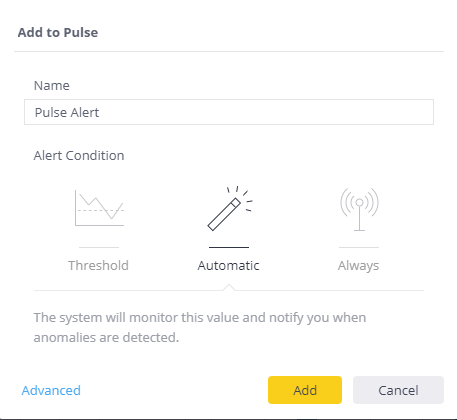
 Knowing when your data trends or financial health changes can make all the difference in the success of your company. Trying to stay on top of this can be tedious at best.Denali BI gives you the ability to set alerts to inform you when specific data changes. These notifications, or Pulse Alerts, can be set based on the parameters you choose. You can set three different types of Pulse Alerts. With a threshold alert, you can stay up-to-date when maximum or minimum thresholds are reached. An automatic alert is powered by Denali BI’s artificial intelligence; it tracks the normal growth of your data and then alerts you to any anomaly that occurs. Finally, you can have the alert occur anytime the data updates.
Contact one of our knowledgeable account executives to learn how Denali BI can improve your data analytics or click here to learn more!
